Available with Image Server
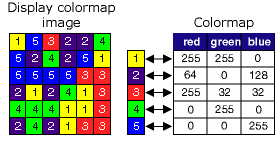
The Colormap function is a raster data renderer. It transforms the pixel values to display the raster data as either a grayscale or an RGB color image based on a color scheme or specific colors in a color map file. You can use a color map to represent analyzed data, such as a classified image or when displaying a topographic map (or an index color-scanned image).


Color maps contain a set of values that are associated with colors used to display a single-band raster consistently with the same colors. Each pixel value is associated with a color, defined as a set of RGB values. Color maps support any bit depth except floating point. They also support positive and negative values and can contain missing color-mapped values. When displaying a dataset with a color map containing missing values, the pixels with the missing values will not be displayed.
When the Colormap function is used, the dataset will be displayed using the color map renderer or a specified color scheme.

Notes
You can also input a .clr file or an .act file from Adobe Photoshop. The .clr file is an ASCII file containing the color map information for each pixel value on a separate line, formatted as pixel_value and associated red, green, and blue values. The following is an example of the contents of a .clr file:
1 255 0 0
2 100 0 100
3 50 200 10
4 45 60 100
The .act file from Adobe Photoshop is a non-ASCII file. The first color in the table has a zero index, and the color is ordered as red, green, and blue. Each color is represented by three bytes, one byte each for red, green, and blue.
If you don't have a color map and you don't want to create one, you can use a color scheme to symbolize the values. Since there is no specific color tied to each value, this will render the data as if you are using the stretched renderer.
If a mosaic dataset is served as an image service, the publisher (or administrator) can serve it using the color map or convert the color map to an RGB image. The color map will automatically be converted to RGB when the image service is served using WMS or WCS.
Parameters
| Parameter | Description |
|---|---|
Raster | The input raster. |
| Color Scheme Type | Specifies the type of color scheme that will be used to render the input raster.
|
| Colormap | Specifies the color map that will be used when Color Scheme Type is Colormap:
Additionally, you can browse to and select an existing color map file that you have access to. |
Color Ramp | The color ramp that will be used when Color Scheme Type is Color Ramp. Choose an existing color ramp or create one. |